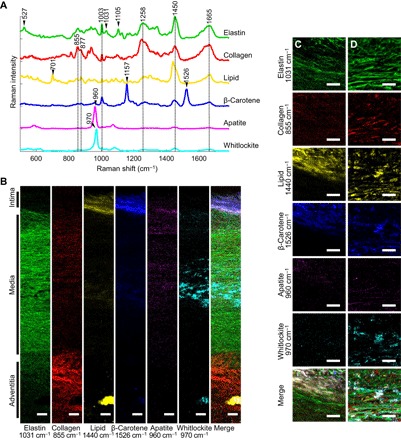
Fig. 1. Univariate Raman spectroscopy images of the cross section of a representative nonatherosclerotic aorta (65 years old).

(A) Representative spectra rich in specific aortic components. (B) Univariate heat maps of the entire cross section of a nonatherosclerotic aorta were plotted according to the signature peaks listed. (C and D) High-resolution maps at the intima-media interface (C) and within the media (D) were also plotted. Merge refers to a composite image of all the univariate heat maps. Scale bars, 100 μm (B) and 50 μm (C and D).
