
Fig. 4. Depth-dependent profiles of the major components in aortic intima and media based on VCA results, normalized to the maximum for each component.
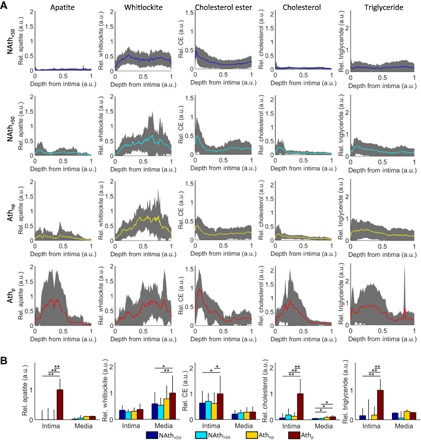
(A) The relative concentration (Rel.) was summed along the normalized depth of the aorta from the surface of the intima; 0, assigned to the media-adventitia interface; 1, plotted with ±1 SD. (B) Averages of the relative concentrations within the intima and media, normalized to area of the Raman images; error bars denote 95% confidence intervals. Statistical significance was defined using GLM regression followed by ANOVA. CE, cholesterol ester. *P < 0.05, **P < 0.01, n ≥ 9 donors per group. a.u., arbitrary units.