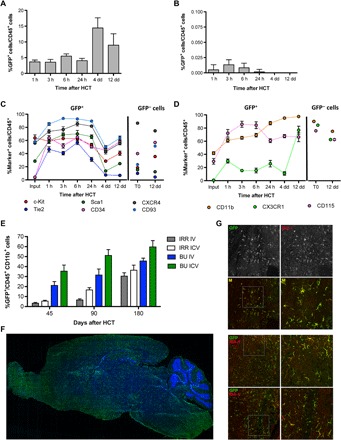
Fig. 1. Myeloid cell reconstitution in the brain after intracerebroventricular injection of HSPCs.

(A and B) Frequency of GFP+ cells identified within CD45+ cells of the brain (A) and BM (B) of BU_TX (BU-treated and transplanted) mice at the indicated time points after intracerebroventricular (ICV) injection of HSPCs transduced with GFP-encoding LVs. n ≥ 3 mice each time point; average and SD are shown. Analyzed by one-way analysis of variance (ANOVA) with Bonferroni post hoc test, 4 days at comparison with 1, 3, 6, and 24 hours shows P < 0.001. (C and D) Expression of the indicated hematopoietic (C) and myeloid/microglia (D) markers by GFP+ (donor) and GFP− (recipient) CD45+ cells retrieved from the brain of BU_TX mice at different time points after intracerebroventricular injection of transduced HSPCs (input represents the HSPCs at time of infusion). n ≥ 3 mice each time point; average and SD are shown. Two-way ANOVA showed a significant effect of the markers and time (P < 0.0001). (E) Frequency of GFP+ cells in the total myeloid (CD45+CD11b+) brain compartment at different time points after intracerebroventricular and intravenous (IV) HSPC transplantation in BU-treated (BU) and irradiated (IRR) mice. n ≥ 5 mice per time point and group; average and SD are shown. Two-way ANOVA showed a significant effect of the route of cell administration and time in BU_TX and IRR mice (intracerebroventricular versus intravenous and time, P < 0.005). (F) Reconstruction of a sagittal brain section of a representative intracerebroventricularly transplanted BU-treated mouse, showing widespread distribution of GFP+ cells at 90 days from GFP-transduced HSPC intracerebroventricular injection. GFP (green) and Topro III (TPIII; blue) for nuclei are shown. Images were acquired via DeltaVision Olympus at 20× magnification and processed using Soft Work 3.5.0. Reconstruction was performed with Adobe Photoshop CS 8.0 software. (G) Immunofluorescence analysis for GFP (green) and IBA-1 (red) on brain sections from BU_TX mice at 90 days after intracerebroventricular transplantation of GFP-transduced HSPCs. M, merge. Magnifications (20× and 40×) of the relative dashed box are shown. Images were acquired using the confocal microscope Radiance 2100 (Bio-Rad) IX70 and processed using Soft Work 3.5.0.
