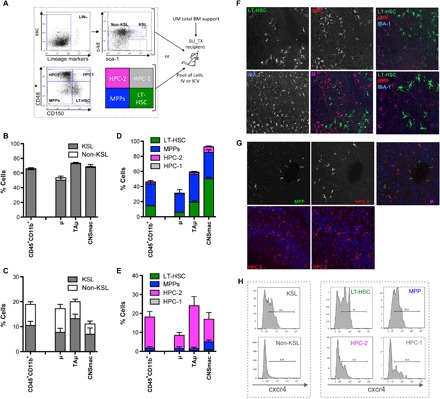
Fig. 2. Posttransplant brain myeloid cells derived from early HSPCs.

(A) Experimental scheme. Prospectively isolated LT-HSCs and progenitors within the HSPC pool as per c-kit, Sca-1, and lineage− staining and use of the SLAM receptor markers CD150 and CD48. The indicated sorted populations were differentially transduced with LVs encoding GFP (KSL) and deleted nerve growth factor receptor (ΔNGFR) (non-KSL), as well as GFP (LT-HSCs), ΔNGFR (MPP), Tag-blue fluorescent protein (BFP) (HPC-1), and Cherry (HPC-2), and subsequently transplanted intravenously (B and D) or intracerebroventricularly (C and E) in competitive fashion at their original ratio into BU-myeloablated mice. Animals transplanted intracerebroventricularly also received unmanipulated (UM) total BM cells for hematopoietic rescue at day 5 after transplant. (B and C) Frequency of cells derived from intravenously (B) or intracerebroventricularly (C) transplanted KSL and non-KSL within total brain myeloid (CD45+CD11b+) cells, μ and TAμ of BU_TX mice at 90 days after transplant. n = 10 mice per group; average and SD are shown. CNSmac, CNS-associated macrophages. (D and E) Frequency of cells derived from each of the transplanted KSL subpopulations within total brain myeloid cells, μ and TAμ of BU-myeloablated mice transplanted intravenously (D) or intracerebroventricularly (E), at different time points after HCT. n = 10 mice per time point and group; average and SD are shown. (F and G) Immunofluorescence analysis of brain slices of BU-treated mice transplanted mice transplanted intravenously (F) or intracerebroventricularly (G) with KSL subpopulations at 90 days after transplant. In (F), the progeny cells of LT-HSC are GFP+ and those of MPPs are ΔNGFR+ (in red). IBA-1 staining is in the blue channel. Magnification, 20×. M, merge. In the right panels, other representative merged pictures at 20× (top) and their 40× magnifications (bottom) are shown. In (G), the progeny cells of HPC-2 are Cherry+ and those of MPPs are ΔNGFR+ (in green). No GFP+ staining was detected in the absence of ΔNGFR immunofluorescence. TPIII (blue) for nuclei is shown. Magnification, 20× (top). In the bottom panels, other representative merged pictures at 20× (top) and their 40× magnifications (bottom) are shown. Images were acquired using the confocal microscope Radiance 2100 (Bio-Rad) and processed using Soft Work 3.5.0.100. (H) Histogram plots showing the differential level of cxcr4 expression in KSL and non-KSL cells, and KSL subpopulations at the time of transplant.
