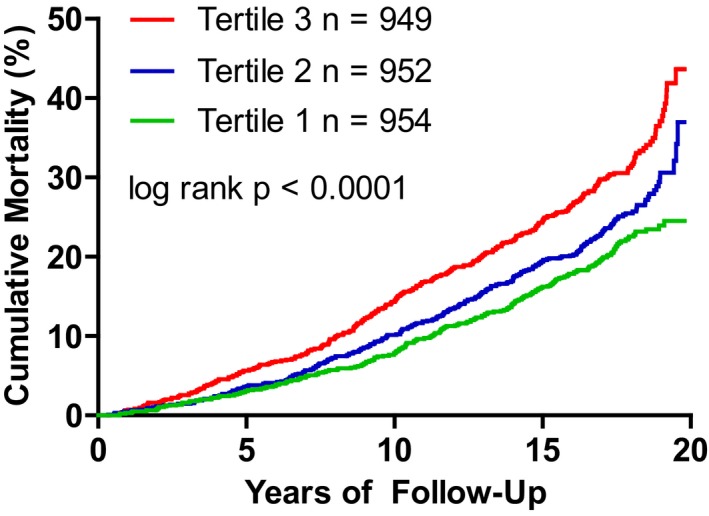
Figure 2.

Kaplan–Meier plot for the relationship between tertile of plasma nitrate and survival (tertile 1=low, tertile 2=intermediate, and tertile 3=high plasma nitrate).

Kaplan–Meier plot for the relationship between tertile of plasma nitrate and survival (tertile 1=low, tertile 2=intermediate, and tertile 3=high plasma nitrate).