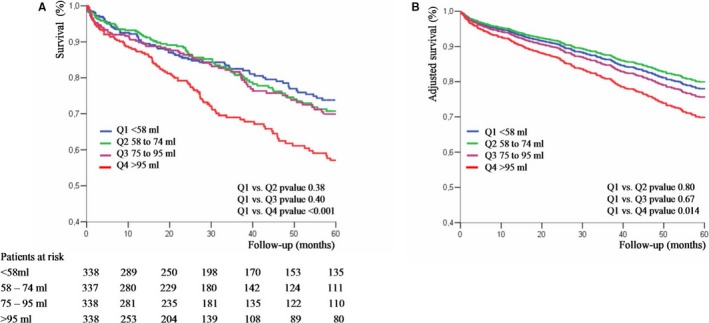
Figure 2.

A, Kaplan‐Meier survival curves of patients with aortic stenosis (AS) according to left atrial volume (LAV) quartiles. B, Adjusted survival curves of patients with AS according to LAV quartiles. Curves are adjusted for age, sex, comorbidity, New York Heart Association class, hypertension, coronary artery disease, ejection fraction, and peak aortic jet velocity. Q1, Q2, Q3, and Q4 indicate first, second, third, and fourth quartiles, respectively.
