Figure 1.

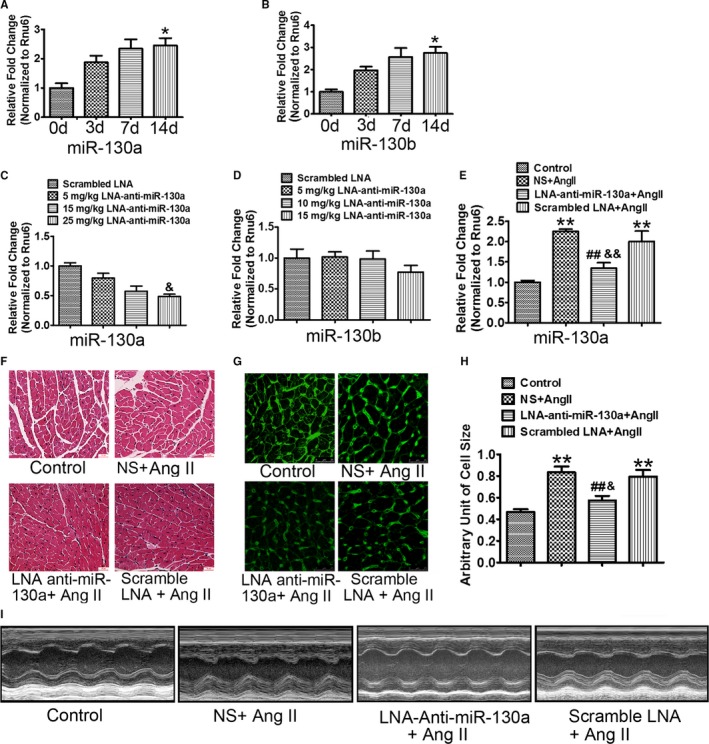
Selective inhibition of miR‐130a rescues Ang II‐induced cardiac damage. Wild‐type mice were treated with Ang II for 3, 7, and 14 d and myocardial expression of miR‐130a (A) and miR‐130b (B) was determined by qRT‐PCR. Rnu6 was used as an internal control. Cardiac miR‐130a (C) and miR‐130b (D) were determined by qRT‐PCR in mice injected with the scrambled LNA (locked nucleic acid) at 25 mg/kg of body weight or LNA‐anti‐miR‐130a at 5, 15, and 25 mg/kg of body weight for 3 d. Rnu6 was used as an internal control. A through D, Data are expressed as means±SE from 3 independent mice. *P<0.05 vs 0 d; & P<0.05 vs scrambled LNA. E, Cardiac miR‐130a was determined by qRT‐PCR in control, NS+Ang II, LNA‐anti‐miR‐130a+AngII, and scrambled LNA+Ang II groups. Rnu6 was used as an internal control. F, Representative H&E staining images in control, NS+Ang II, LNA‐anti‐miR‐130a+AngII, and scrambled LNA+Ang II groups. Scale bars indicate 30 μm. G and H, Representative WGA (wheat germ agglutinin) staining images of left ventricles (G) and histogram of cardiac myocyte cross‐sectional area derived from WGA staining (H) (100 myocytes in each section were scanned and averaged for each group). Scale bars indicate 25 μm (G). E and H, Data are expressed as means±SE from 6 independent mice. **P<0.01 vs control; ## P<0.01 vs NS+Ang II; && P<0.01 vs scrambled LNA+Ang II. I, Representative LV (left ventricular) trace images showing the LV thickness and LV free wall for control, NS+Ang II, LNA‐anti‐miR‐130a+AngII, and scrambled LNA+Ang II groups, respectively. Ang II indicates angiotensin II; mIR‐130a, microRNA‐130a; NS, normal saline; qRT‐PCR, quantitative reverse transcriptase polymerase chain reaction.
