Figure 2.

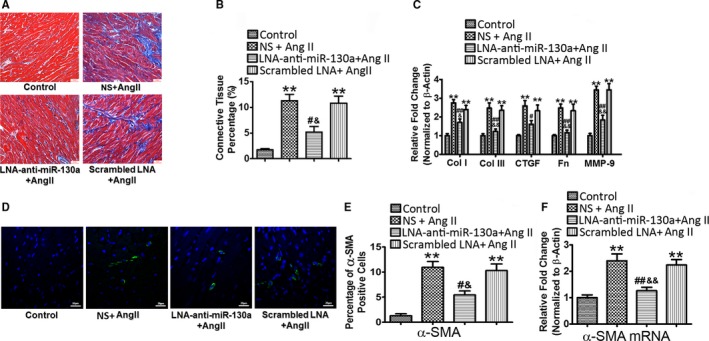
Inhibition of miR‐130a reduces cardiac fibrosis and myofibroblast differentiation in vivo. Representative image of Masson's trichrome staining (A) and histogram of connective tissue percentage of hearts (B). Blue staining indicates connective tissue (n=6); 6 fields in each sample were scanned and averaged. Scale bars indicate 30 μm. C, Cardiac gene expression of Col I, Col III, CTGF (connective tissue growth factor), Fn (fibronectin), and MMP‐9 was determined by qRT‐PCR. β‐Actin was used as an internal control. D, Representative immunofluorescence images of α‐SMA in control, NS+Ang II, LNA‐anti‐miR‐130a+Ang II, and scrambled LNA+Ang II groups. Green signals represent α‐SMA protein and blue signals represent nuclei. Scale bars indicate 20 μm. E, Quantification of α‐SMA‐positive myofibroblasts from the immunofluorescence images of (D). Three fields in each sample were counted and calculated, n=6 in each group. F, Cardiac gene expression of α‐SMA was determined by qRT‐PCR. β‐Actin was used as an internal control. Data are expressed as means±SE from 6 independent mice. **P<0.01 vs control; # P<0.05, ## P<0.01 vs NS+Ang II; & P<0.05, && P<0.01 vs scrambled LNA+Ang II. Ang II indicates angiotensin II; Col I, Col III, collagen I, collagen III; CTGF, connective tissue growth factor; LNA, locked nucleic acid; miR‐130‐a, microRNA‐130‐a; MMP‐9, matrix metalloproteinase 9; NS, normal saline; qRT‐PCR, quantitative reverse transcriptase polymerase chain reaction; α‐SMA, α‐smooth muscle actin.
