
Figure 2.
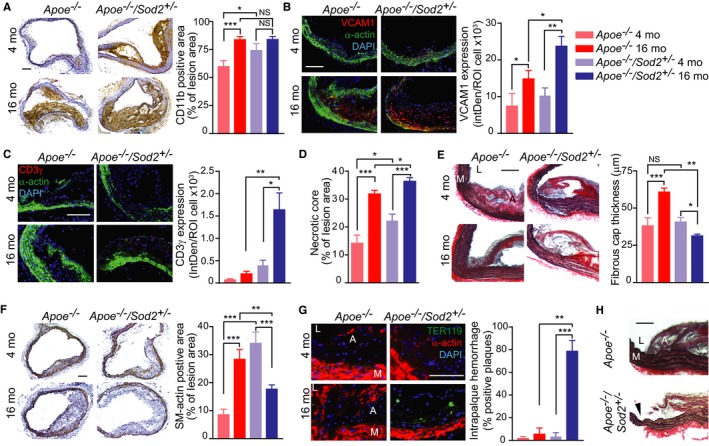
Atherosclerotic plaque morphology in young and middle‐aged Apoe −/− and Apoe −/−/Sod2 +/− mice. A, Representative images of aortic transverse sections were stained for immunoreactive CD11b and inflammatory cell infiltration determined by quantification of the CD11b‐positive staining area (mean±SEM, n=8). B and C, Representative images of aortic transverse sections stained for immunoreactive VCAM1 (B) or CD3γ (C) (red), smooth muscle α‐actin (green), and DAPI (blue) and quantification of VCAM1 (B) or CD3γ (C) expression represented as fluorescence integrated density (IntDen) per number of cells (mean±SEM, n=8). D, Necrotic core size was determined by measuring the acellular fraction of the total plaque area (mean±SEM, n=9). E, Representative images of transverse aortic sections stained with Verhoeff picrosirius red and quantification of the fibrous cap thickness measured at the atherosclerotic plaque shoulder region (mean±SEM, n=8). F, Representative images of transverse sections stained for smooth muscle α‐actin. Atherosclerotic plaque smooth muscle content was quantified by measuring the α‐actin‐positive staining area (mean±SEM, n=8). G, Representative images of aortic sections stained for TER119 (green), smooth muscle α‐actin (red) and DAPI (blue) and quantification of number of transverse aortic sections positive for intraplaque hemorrhage (mean±SEM, n=9). H, Representative images of transverse aortic sections from middle‐aged Apoe −/− and Apoe −/−/Sod2 +/− mice stained with Verhoeff picrosirius red showing interruption of fibrous cap (arrowhead). A indicates atheroma; L, lumen; M, media. Scale is 100 μm. *P<0.05; **P<0.01; ***P<0.001; NS, not significant; SEM, standard error of the mean.