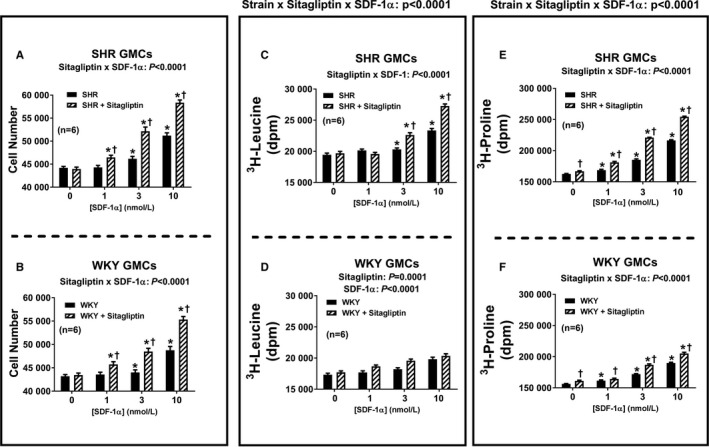
Figure 5.

Bar graphs depict the concentration‐dependent effects of SDF‐1α (stromal cell‐derived factor 1α; 1, 3, and 10 nmol/L) on cell number (A and B), 3H‐leucine incorporation (C and D), and 3H‐proline incorporation (E and F) in glomerular mesangial cells (GMCs) from spontaneously hypertensive rats (SHR; A, C, and E) and normotensive Wistar–Kyoto rats (WKY; B, D, and F) in the absence and the presence of sitagliptin (1 μmol/L). The P values at the top of the main panels for 3H‐leucine incorporation (C and D) and 3H‐proline incorporation (E and F) are the 3‐way interaction P values from a 3‐factor ANOVA. These P values demonstrate that the strain from which the cells were derived (SHR vs WKY) interacts with sitagliptin to determine the overall effects of SDF‐1α on 3H‐leucine incorporation and 3H‐proline incorporation. For cell number, however, the strain×sitagliptin×SDF‐1α interaction was not significant. The P values at the top of subpanels (A, B, C, E, and F) are the 2‐way interaction P values from a 2‐factor ANOVA. These P values demonstrate that sitagliptin augmented responses to SDF‐1α. In WKY GMCs, SDF‐1α and sitagliptin modestly enhanced 3H‐leucine incorporation, but the interaction was not significant. *Significant difference (P<0.05; Fisher least significant difference test) between the indicated concentration of SDF‐1α and the basal values (ie, values in the absence of SDF‐1α) for the indicated variable. †Significant difference (P<0.05; Fisher least significant difference test) between sitgliptin‐treated and non‐sitagliptin‐treated cells at indicated concentration of SDF‐1α. Values are means and SEM.
