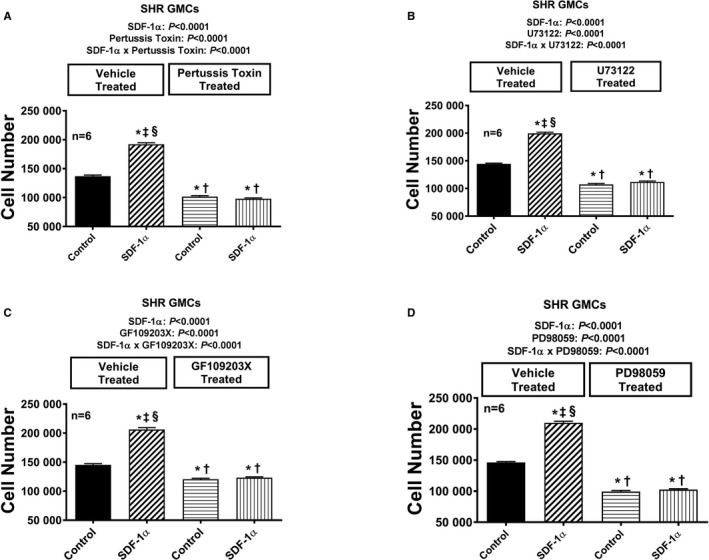
Figure 13.

Bar graphs illustrate the effects of SDF‐1α (stromal cell‐derived factor 1α; 10 nmol/L, with added sitagliptin at 1 μmol/L to enhance the response) on cell number in the absence and the presence of pertussis toxin (A; 100 ng/mL), U73122 (B; 10 μmol/L), GF109203X (C; 10 μmol/L), and PD98059 (D; 10 μmol/L) in glomerular mesangial cells (GMCs) from spontaneously hypertensive rats (SHR). Each set of P values in each panel are from a 2‐factor ANOVA (factor A, level of SDF‐1α; factor B, level of indicated inhibitor). The interaction P values show that the effects of SDF‐1α were blocked by the indicated inhibitor. *,†,‡,§Significant difference (P<0.05; Fisher least significant difference test) from the first, second, third, and fourth columns, respectively. Values are means and SEM.
