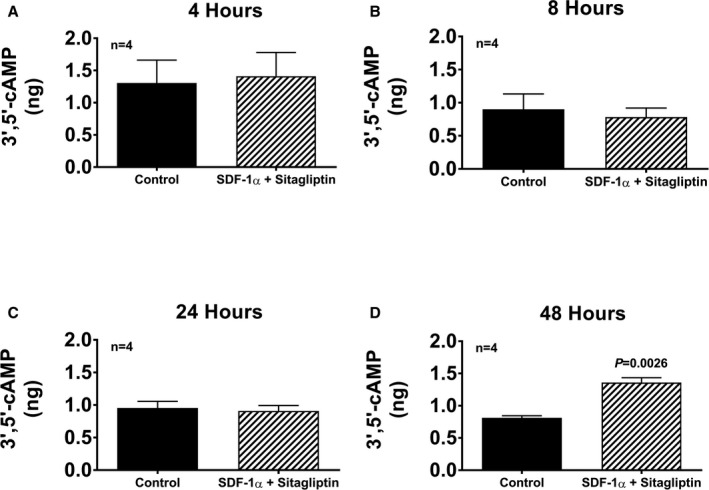
Figure 17.

Bar graphs show intracellular levels of 3′,5′‐cAMP in cardiac fibroblasts (CFs) from spontaneously hypertensive rats treated for 4, 8, 24, and 48 h (A through D, respectively) with SDF‐1α (stromal cell‐derived factor 1α; 10 nmol/L) plus sitagliptin at (1 μmol/L). Values are means and SEM.
