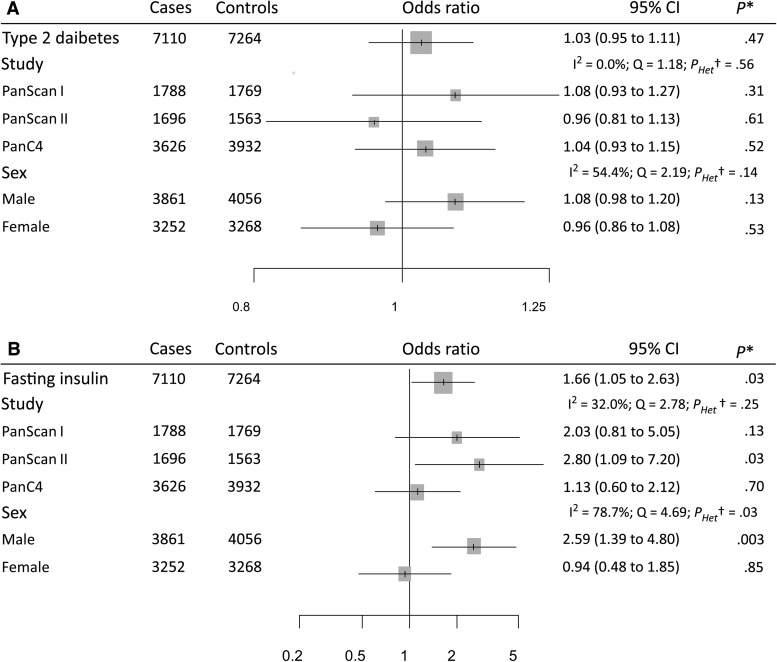
Figure 3.
Forest plots of risk increase on pancreatic cancer for type 2 diabetes status (A) and for each standard deviation increase in fasting insulin levels (B), stratified by publication sets and sex. *Likelihood-based Mendelian randomization test. P values are two-sided. †Heterogeneity Q test. Pheterogeneity values are two-sided. CI = confidence interval; I2 = index of between-strata heterogeneity; OR = odds ratio; Q = statistic for between-strata heterogeneity.

