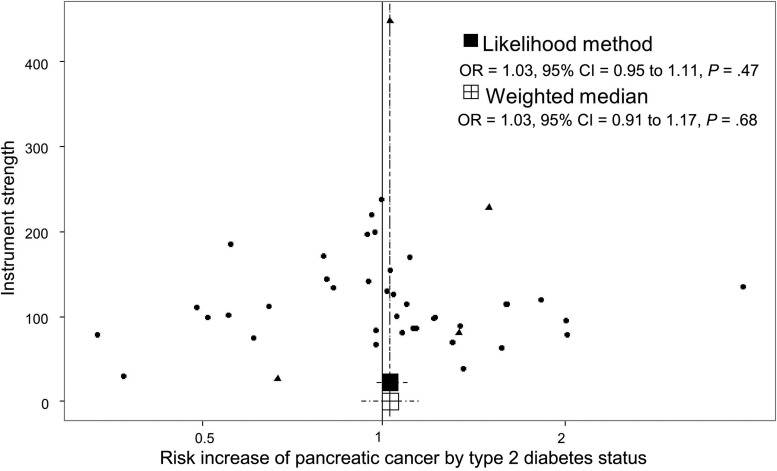
Figure 6.
Funnel plot of risk estimates of type 2 diabetes–instrumental single-nucleotide polymorphisms (SNPs) on pancreatic cancer against instrumental strength. Instrumental strength is SNP to pancreatic cancer effect corrected by SNP to type 2 diabetes standard error of the effect. X-axis is in logarithmic scale. SNPs also robustly associated with BMI (4 SNPs) are depicted as triangles. P values are two-sided, Mendelian randomization test. CI = confidence interval; OR = odds ratio.

