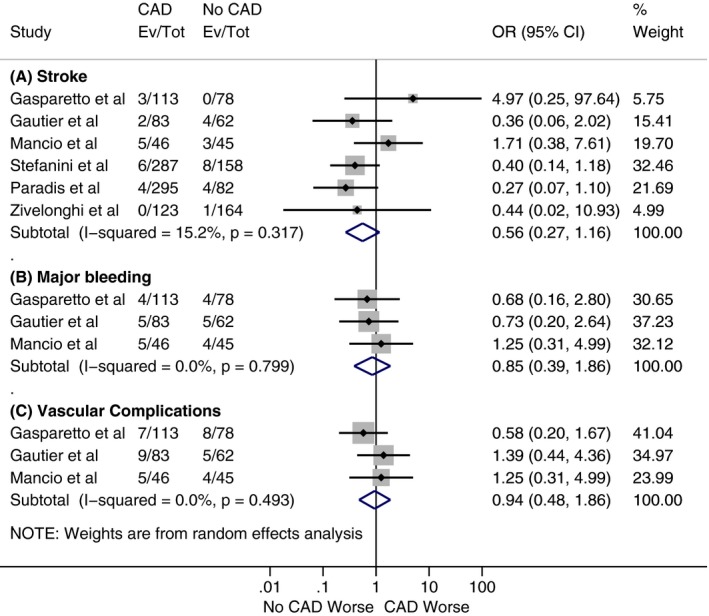
Figure 5.

Forest plots comparing (A) 30‐day risk of stroke, (B) 30‐day risk of major bleeding, and (C) 30‐day risk of vascular complications between patients with and without coronary artery disease (CAD). The diamond indicates the overall summary estimate for the analysis. The center of the diamond represents the point estimate and the width represents 95% confidence interval (CI). OR indicates odds ratio.
