
Figure 2.
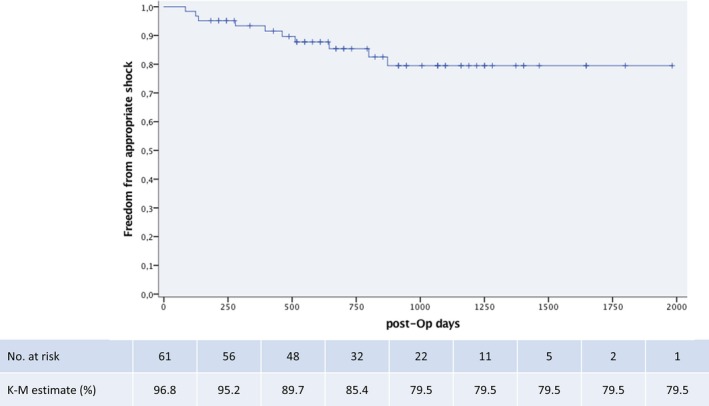
Kaplan–Meier curve showing proportion of patients with event‐free survival. K‐M indicates Kaplan–Meier; post‐Op, postoperative.
Official websites use .gov
A
.gov website belongs to an official
government organization in the United States.
Secure .gov websites use HTTPS
A lock (
) or https:// means you've safely
connected to the .gov website. Share sensitive
information only on official, secure websites.
Kaplan–Meier curve showing proportion of patients with event‐free survival. K‐M indicates Kaplan–Meier; post‐Op, postoperative.