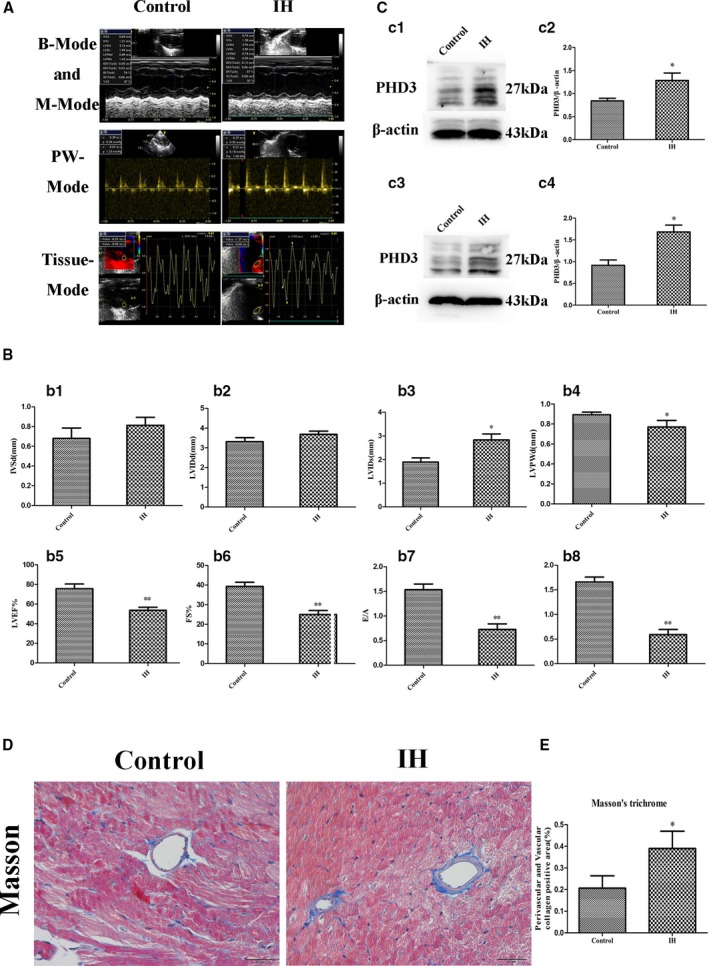
Figure 1.

Change of cardiac function, PHD3 expression, and collagen deposition after IH treatment. A, Representative echocardiographic images of 2D echocardiograms, M‐mode echocardiograms, pulsed‐wave Doppler echocardiograms, and tissue Doppler echocardiograms in all groups. B, Quantitative analysis of echocardiographic measurements parameters. b1, Interventricular septum dimension (IVSD). b2, Left ventricular end‐diastolic dimension (LVIDd). b3, Left ventricular end‐systolic dimension (LVIDs). b4, Left ventricle posterior wall dimension (LVPWd). b5, Left ventricular ejection fraction (LVEF). b6, Fractional shortening (FS). b7, Early to late mitral flow (E/A). b8, Early to late ratio of diastolic mitral annulus velocities (E′/A′). Data are mean±SD; n=10 per group. *P<0.05 vs control; **P<0.01 vs control. C, Western blot analysis of PHD3 (c1) and quantitative analysis (c2) in vivo. Western blot analysis of PHD3 (c3) and quantitative analysis (c4) in vitro. *P<0.05 vs control. D, Representative images of the heart section with Masson's trichrome (blue staining) for each group (original magnification, ×400; bars=20 μm). E, Quantification of Masson's trichrome staining. Data are mean±SD; n=10 per group. *P<0.05 vs control. 2D indicates 2‐dimensional; IH, intermittent hypoxia; PHD3, prolyl 4‐hydroxylase domain protein 3.
