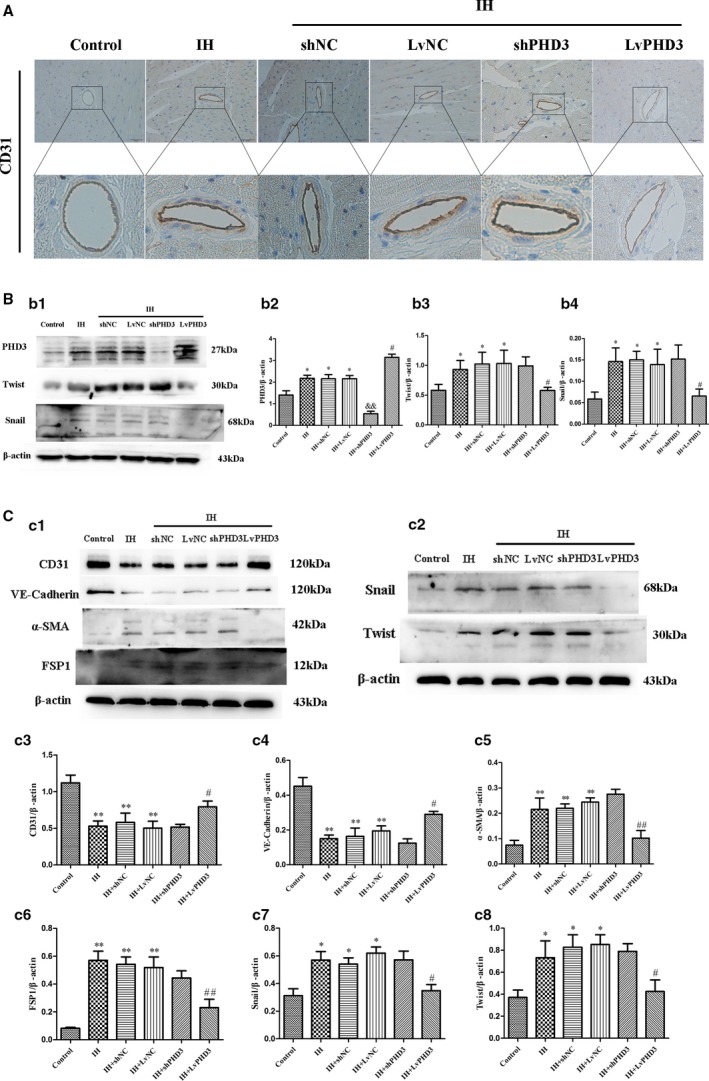
Figure 5.

PHD3 overexpression improve IH‐induced EndMT. A, Representative images of immunohistochemical staining of CD31 (yellow staining) in the perivascular and vascular region (original magnification, ×400; bars=20 μm). B, Western blot analysis and quantification of snail (b1 and b2) and twist (b1 and b3) in vivo. C, Western blot analysis and quantification of CD31 (c1 and c3), VE‐Cadherin (c1 and c4), α‐SMA (c1 and c5), FSP1 (c1 and c6), snail (c2 and c7), and twist (c2 and c8) in vivo. Data are mean±SD; *P<0.05 vs control; **P<0.01 vs control; # P<0.05 vs IH+LvNC; ## P<0.01 vs IH+LvNC; && P<0.01 vs IH+shNC. EndMT indicates endothelial‐to‐mesenchymal transition; FSP1, fibroblast‐specific protein‐1; IH, intermittent hypoxia; LvPHD3, lentivirus carrying PHD3 cDNA; PHD3, prolyl 4‐hydroxylase domain protein 3; shPHD3, short‐hairpin PHD3; α‐SMA, alpha‐smooth muscle actin; VE, vascular endothelial.
