
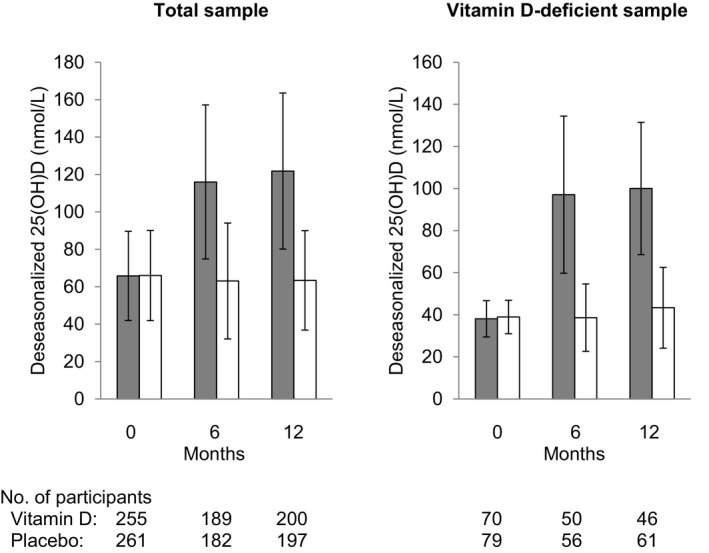
Figure 2.
Bar graphs showing deseasonalized 25(OH)D concentration (nmol/L) at baseline and follow‐up (6 and 12 mo) in the vitamin D (gray bars) and placebo (white bars) groups. The bars represent mean±SD.
Official websites use .gov
A
.gov website belongs to an official
government organization in the United States.
Secure .gov websites use HTTPS
A lock (
) or https:// means you've safely
connected to the .gov website. Share sensitive
information only on official, secure websites.
Bar graphs showing deseasonalized 25(OH)D concentration (nmol/L) at baseline and follow‐up (6 and 12 mo) in the vitamin D (gray bars) and placebo (white bars) groups. The bars represent mean±SD.