
Figure 1.
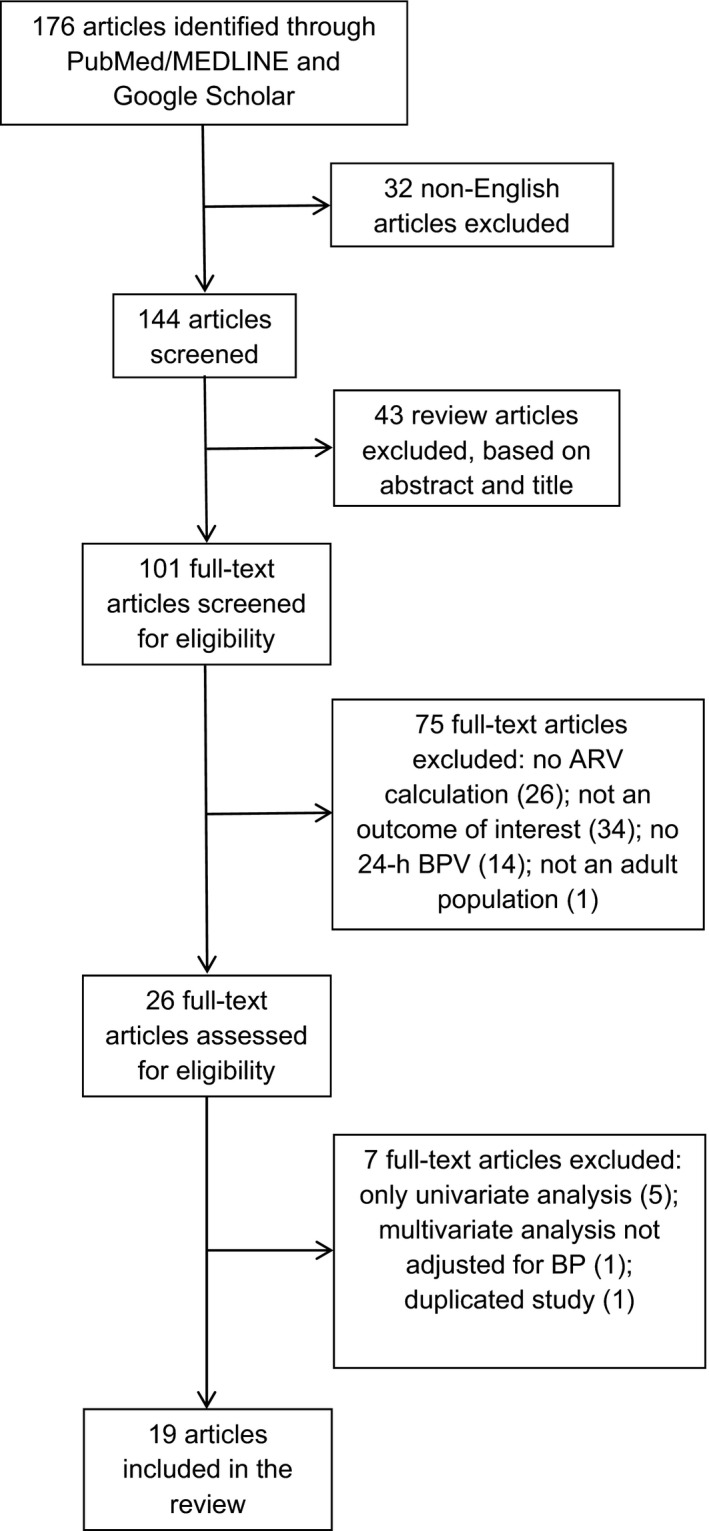
Flow chart showing the process for selection of articles. ARV indicates average real variability; BP, blood pressure; and BPV, BP variability.
Official websites use .gov
A
.gov website belongs to an official
government organization in the United States.
Secure .gov websites use HTTPS
A lock (
) or https:// means you've safely
connected to the .gov website. Share sensitive
information only on official, secure websites.
Flow chart showing the process for selection of articles. ARV indicates average real variability; BP, blood pressure; and BPV, BP variability.