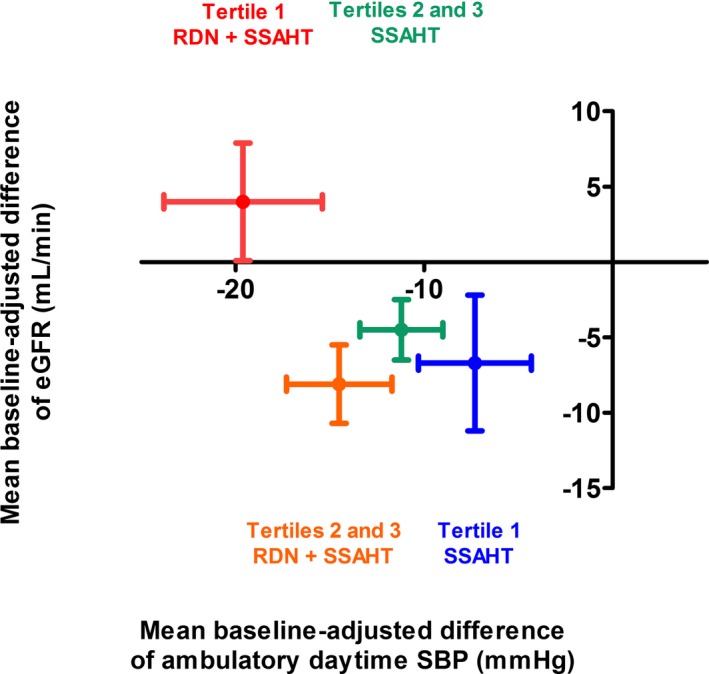
Figure 5.

Relationship between the changes from baseline to 6 months in mean baseline‐adjusted eGFR and daytime ambulatory SBP in the 4 subgroups of patients. Red plot: patients of tertile 1 for AAC volume treated with RDN plus SSAHT; green plot: patients of tertiles 2 and 3 for AAC volume treated with RDN plus SSAHT; blue plot: patients of tertile 1 for AAC volume treated with SSAHT alone; orange plot: patients of tertiles 2 and 3 for AAC volume treated with SSAHT alone. The data shown are mean±SD. AAC indicates abdominal aortic calcifications; eGFR, estimated glomerular filtration rate; RDN, renal denervation; SBP, systolic blood pressure; SSAHT, standardized stepped‐care antihypertensive treatment.
