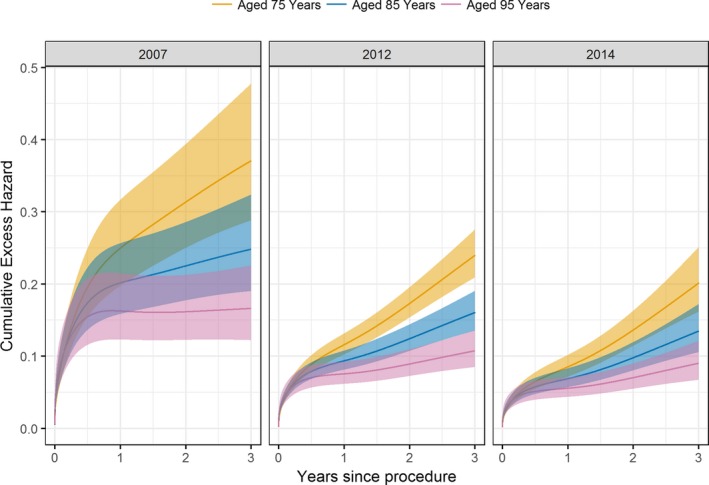
Figure 6.

Predicted cumulative excess hazard curves for patients aged 75, 85, and 95 years, across increasing procedure year, obtained from the flexible parametric relative survival model. The 95% confidence intervals are indicated by the shaded areas.
