
Figure 7.
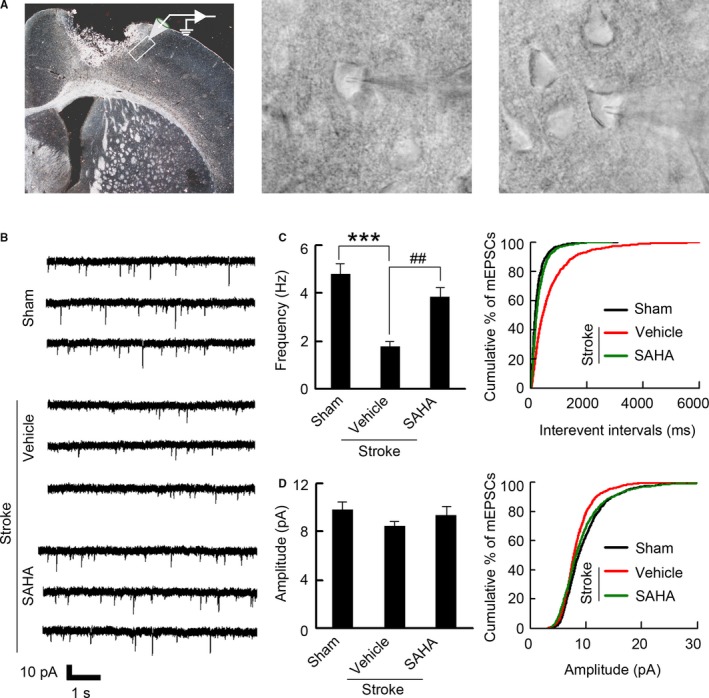
SAHA treatment results in increased frequency of mEPSCs. A, Left: Image showing the peri‐infarct recording site. Whole‐cell patch‐clamp recordings were made from poststroke brain slices, within 200 μm of the infarct (image under ×5 magnification). Middle: Representative image showing patch‐clamp from peri‐infarct pyramidal neuron (images under ×40 magnification). Right: Representative image showing control recording from pyramidal neuron at the same location as peri‐infarct area (images under ×40 magnification). B, Representative recordings of mEPSCs from the neurons in the peri‐infarct cortex. C, Bar graph and cumulative distribution plots showing mEPSCs frequency (n=14 for each group, from 5 to 8 animals per group, 1‐way ANOVA, ***P<0.001, vs sham; ## P<0.01, vs vehicle). D, Bar graph and cumulative distribution plots showing mEPSCs amplitude (n=14 for each group, from 5 to 8 animals per group, 1‐way ANOVA, P=0.578). mEPSCs indicates miniature excitatory postsynaptic currents; SAHA, suberoylanilide hydroxamic acid.