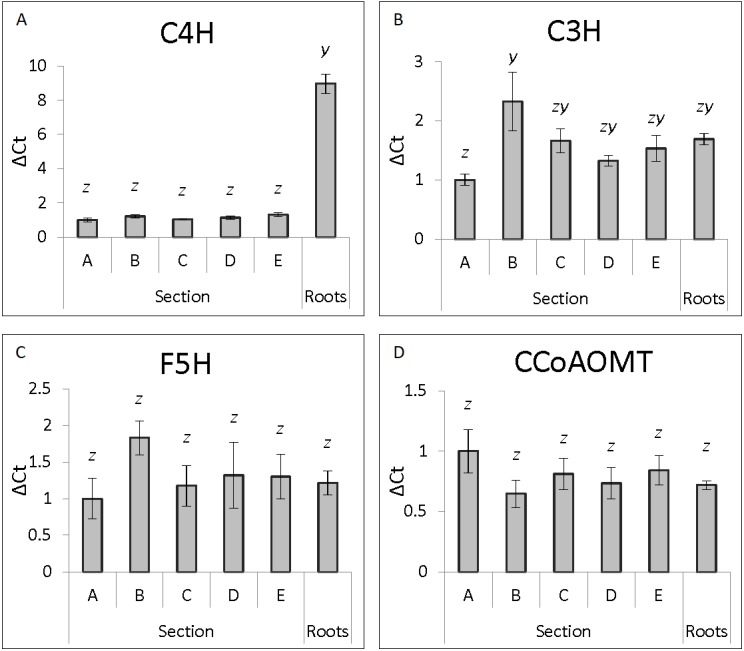
Figure 3. Genes showing consistent expression along developmental gradient.

ΔCt expression levels of lignin biosynthesis genes from the five stem sections and roots (n = 5 individual plants per tissue section) normalized against section A for each individual gene is shown with standard error of the mean. Statistical differences are noted by different letters above bars (x, y and z) after ANOVA analysis with Tukey post-hoc analysis (p ≤ 0.05).
