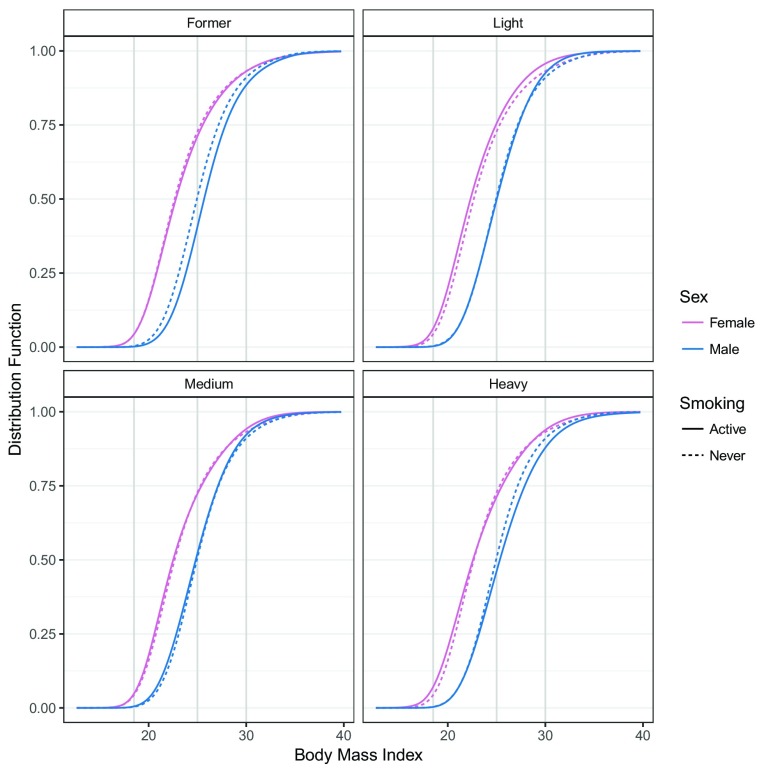
Figure 1. Conditional distribution of BMI.
For each combination of smoking and sex, the conditional distribution function of BMI ℙ(BMI ≤ b | smk, sex, x) corresponding to model (4) was evaluated for baseline covariates x at all possible BMI values b. Red, female BMI distributions; blue, male BMI distributions; solid lines, BMI distributions of active smokers; dashed lines, never smoked; gray vertical lines, WHO categories 18.5, 25, 30. The model was fitted using “exact” BMI values.

