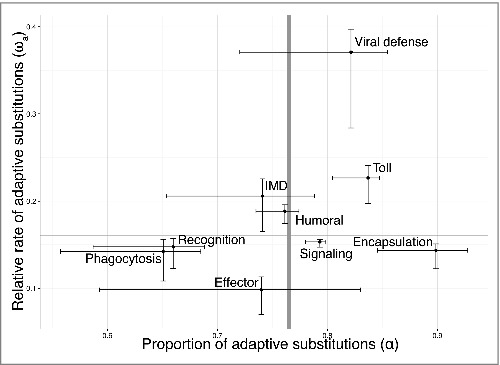
Figure 1.

Proportion of adaptive substitutions (α) and the rate of adaptive substitutions (ωa) in a subset of key immune gene classes. The statistic α compares the neutral and adaptive divergence between 2 species to the neutral and adaptive polymorphism currently observed within one of those species. The statistic ωa similarly considers both adaptive divergence and adaptive polymorphism, and gives the adaptive substitution rate relative to the neutral one. Both metrics were calculated with the program DFE-alpha40 using D. melanogaster-D. simulans nucleotide divergence and polymorphism data from the Zimbabwe D. melanogaster population. The 95% confidence intervals were calculated with jackknife resampling. The gray bars mark the α and ωa values calculated with a set of non-immune control genes.
