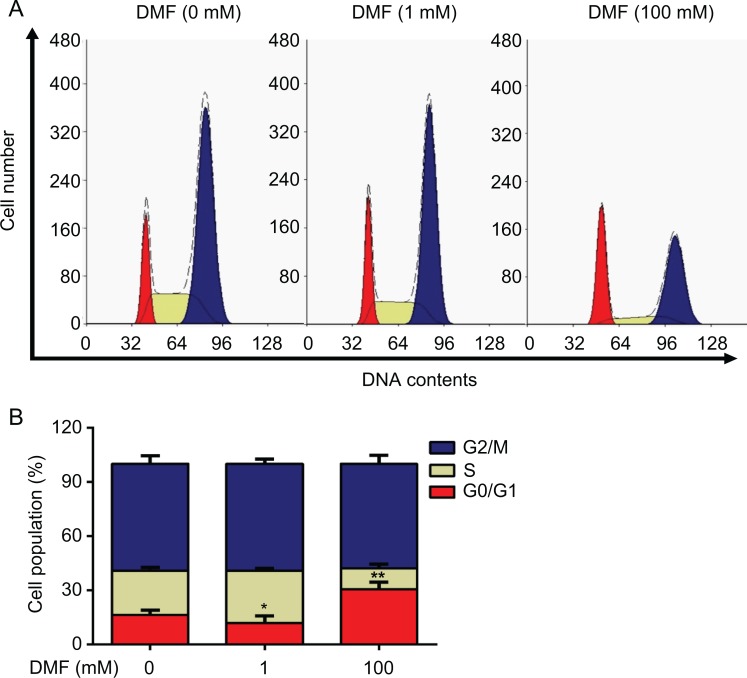
Figure 3.
Effect of DMF on cell cycle in MCF-7 cells. Cells were treated with different doses (0, 1, and 100 mM) of DMF for 72 hours. A, Cell cycle was determined by flow cytometry. B, The histogram shows the percentage of the cell population in different phases of cell cycle. The experiment was repeated at least 3 times. Data represent the mean ±SD. *P < .05; **P < .01. DMF indicates N,N-dimethylformamide; SD, standard deviation.

