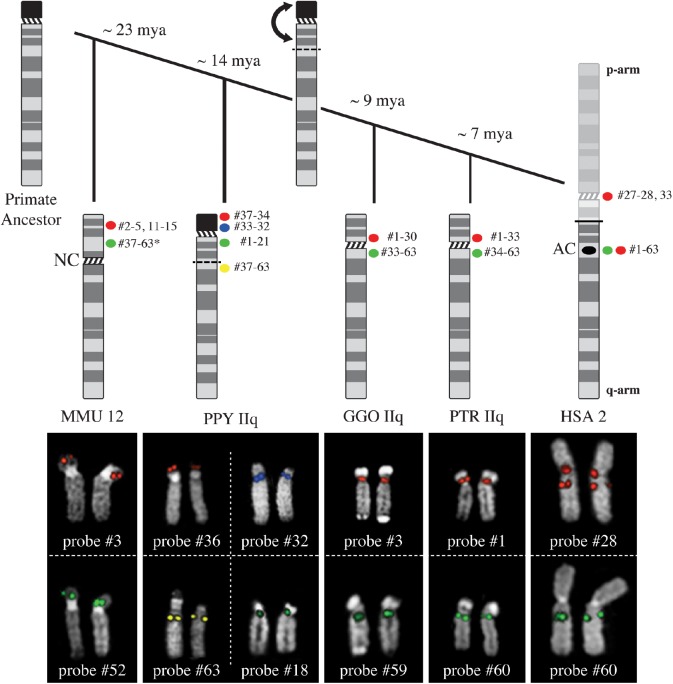
Fig. 2.
For every species, probes with the same FISH pattern were grouped and representative results for each class are displayed. In HSA, all fosmids mapped to chromosome 2, only three of them mapped both on the ancestral centromere (AC) and on the primary constriction of chromosome 2 (HSA red signals). For the other species, we used the chromosome IIq active centromere as a landmark. In PTR and GGO, we were able to group the FISH results into two classes, since some probes mapped to the p-side of the centromere, whereas others to the q-side. In PPY, we distinguished four clusters of signals, two for each chromosome arm: we observed distal and proximal signals on both the p- and q-arm. Finally, in MMU we detected signals only on the p-arm, where the inactivated centromere is located. The active centromere is a neocentromere (NC). The * indicates that not all probes from #37 to #63 actually mapped on MMU 12.

