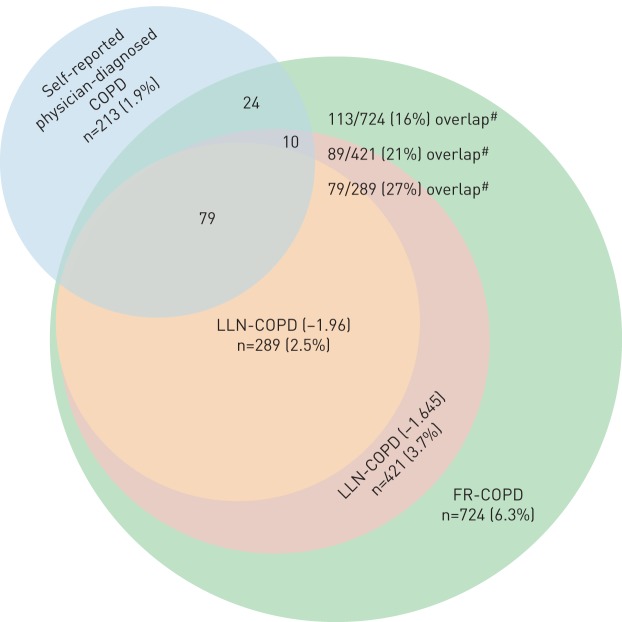
FIGURE 2.
Venn diagram showing the overlap between the various chronic obstructive pulmonary disease (COPD) diagnoses: self-reported physician-diagnosed, fixed ratio (FR) and lower limit of normal (LLN). #: p-values <0.001 for the difference in overlap between FR-COPD and LLN (−1.96) and 0.02 for the difference in overlap between FR-COPD and LLN (−1.645).

