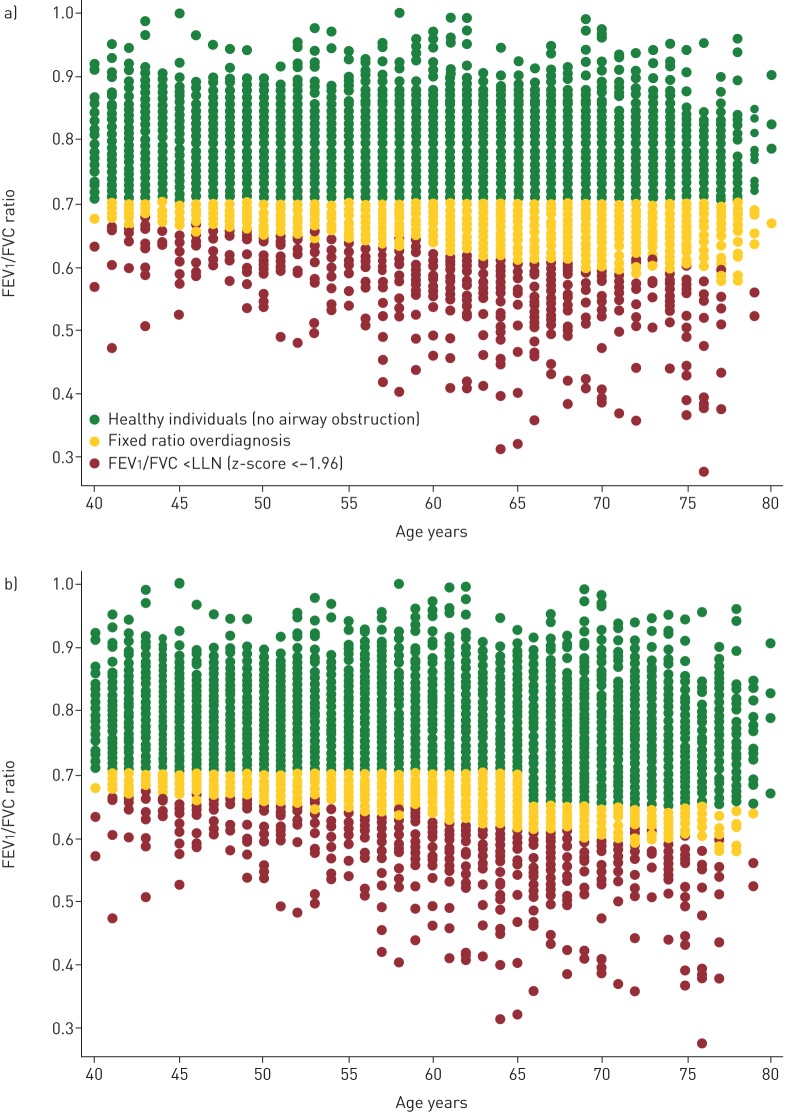
FIGURE 3.
a) Forced expiratory volume in 1 s (FEV1)/forced vital capacity (FVC) ratio as a function of age showing individuals with FEV1/FVC ratio less than the lower limit of normal (LLN) (z-score <−1.96) and potentially overdiagnosed individuals with the use of the fixed ratio; b) the proportion of potentially overdiagnosed patients is reduced with the introduction of the 65/65 model, but overdiagnosis is still present.

