FIGURE 4.

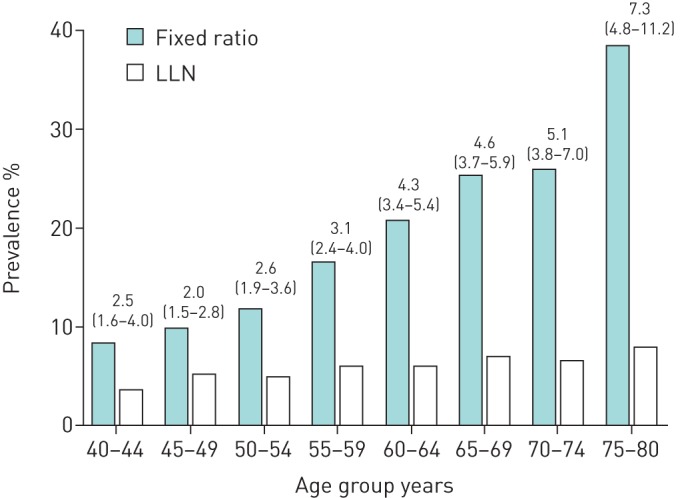
Prevalence of airway obstruction in a random population assessed by fixed ratio and lower limit of normal (LLN) stratified by age. Data are presented as odds ratio (95% CI).

Prevalence of airway obstruction in a random population assessed by fixed ratio and lower limit of normal (LLN) stratified by age. Data are presented as odds ratio (95% CI).