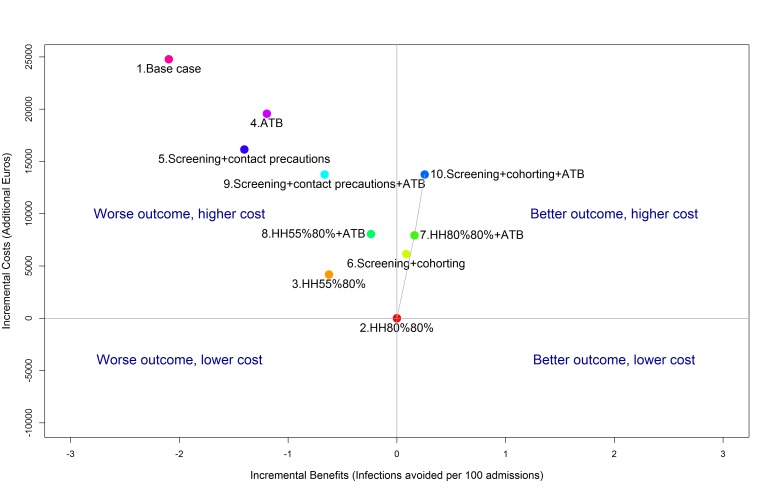
Figure 3.
Cost-effectiveness plane showing the incremental health benefits (infections avoided) and costs relative to the least expensive strategy (strategy 2). Strategies 1, 3, 4, 5, 8, 9 are dominated as they have both a worse outcome and a higher cost. The efficiency frontier (grey line), joins strategy 2 with more expensive and more efficient strategies (7 and 10). Strategy 6 is extended to this frontier and excluded by the principle of extended dominance. The slope of the efficiency frontier represents the incremental cost-effectiveness. Strategies are: (1) base case (reference strategy with no control intervention and hand hygiene (HH) compliance of 55%/60% before/after patient contact); (2) HH improvement to 80%/80%; (3) HH improvement to 55%/80%; (4) antibiotic (ATB) reduction; (5) screening of all admissions and contact precautions with identified carriers; (6) screening of all admissions and cohorting of identified carriers; (7) HH improvement to 80%/80% and antibiotic reduction; (8) HH improvement to 55%/80% and antibiotic reduction; (9) screening of all admissions, contact precautions with identified carriers and antibiotic reduction; (10) screening of all admissions, cohorting of identified carriers and antibiotic reduction.

