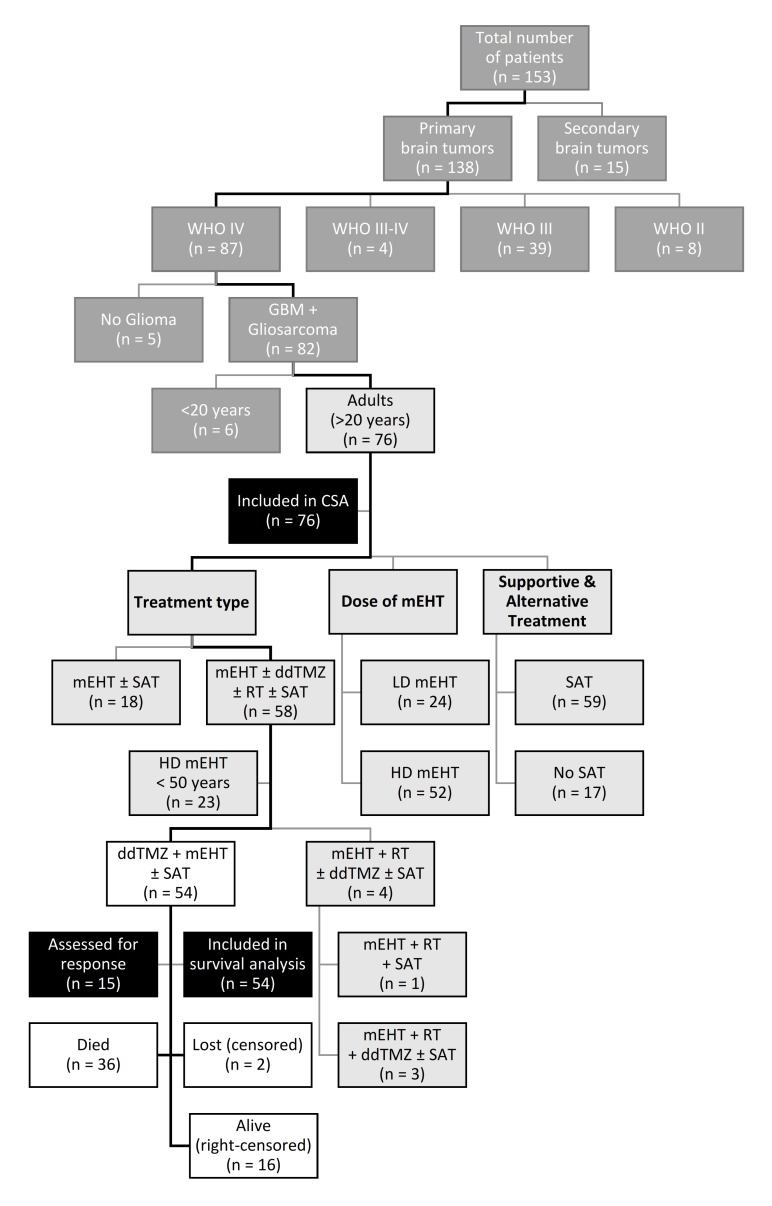
Figure 2.
CONSORT flow chart. White: COI, cohort of interest; light grey: CSA, cohorts of covariate survival analysis; dark grey: cohorts out of analysis; black: analyses; ddTMZ, dose-dense temozolomide; GBM, glioblastoma; mEHT, modulated electrohyperthermia; SAT, supportive and alternative treatments.

