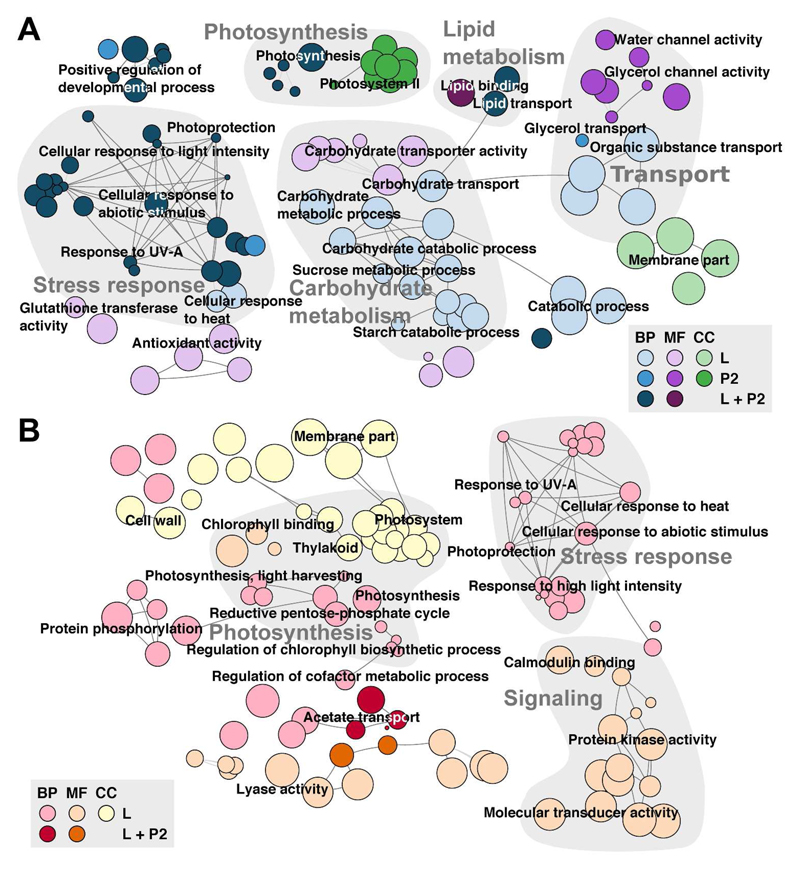
Figure 5.
GO Network displaying all enriched categories in both groups L and P2 as well as A) up- and B) downregulation. The root categories are “Biological Process” (BP; blue or red), “Molecular Function” (MF; violet or orange) and “Cellular Component” (CC; green or yellow). Edges depict shared terms. Highlighted in grey are selected groups such as photosynthesis, lipid metabolism, transport, carbohydrate metabolism, stress response and signaling.

