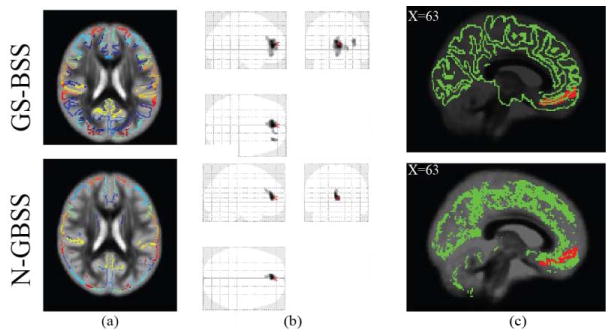
Fig. 4.
Comparison between N-GBSS and GS-BSS methods (a) Segmented GM skeletons with corresponding multi atlas labels. (b) VBM results for whole brain analysis after registration with threshold at 250 voxels (p<0.001 uncorrected) (c) GM skeletons with mFC region (red) overlaid on mean ODI where N-GBSS has less coverage compared to GS-BSS.

