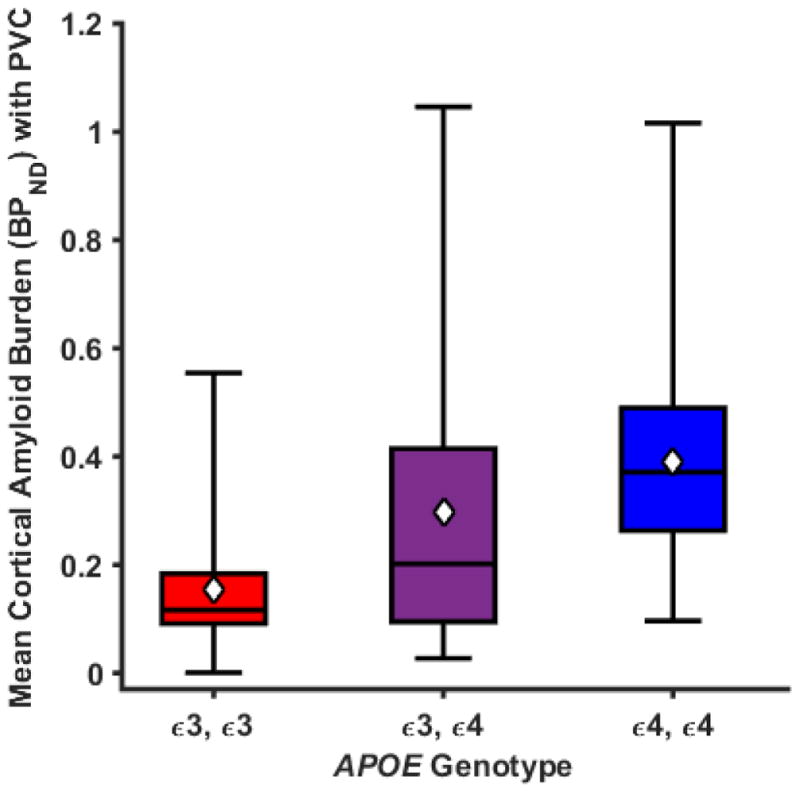
Figure 1. Box plots of mean cortical Aβ burden (BPND) by APOE genotype.

Boxes define the interquartile range. The black horizontal lines indicate medians and the white diamonds indicate the means. Plotted values are unadjusted means and statistical analysis was performed using a generalized linear model adjusted for age and sex. The APOE genotype variable is significant with p = 0.003 (n =15 per group).
