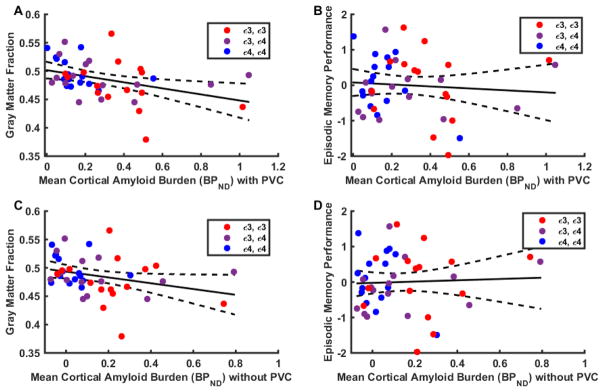
Figure 2. Association between cortical Aβ burden (BPND) and cortical gray matter (GM) fraction (A, C) or episodic memory performance (B, D).
Plotted values are partial volume corrected BPND for the mean cortical ROI (A) and unadjusted cortical gray matter fraction (regression coefficient = −0.046, p = 0.017) or (B) episodic memory performance (regression coefficient = −0.317, p = 0.558). Gray matter masked BPND without partial volume correction for the mean cortical ROI (C) and unadjusted cortical gray matter fraction (regression coefficient = −0.046, p = 0.048) or (D) episodic memory performance (regression coefficient = 0.1271, p = 0.846) are also shown. Episodic memory performance is the average of z-scores for CVLT free delayed recall and Logical Memory II. The figure displays unadjusted linear regression lines with their 95% confidence intervals. Statistical analysis was performed using general linear models adjusted for age and sex.

