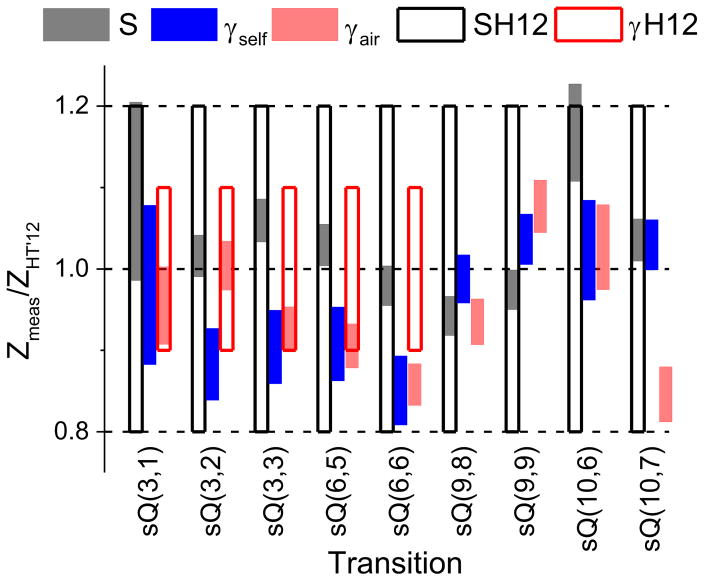
Fig. 10.
Comparison of measured line intensities, self- and air-broadening coefficients with HITRAN’12 database. The unfilled bars indicate the uncertainties specified in HITRAN’12 database (H12). The transitions with missing H12 bars indicate “average or estimate” uncertainty estimate in HITRAN’12.

