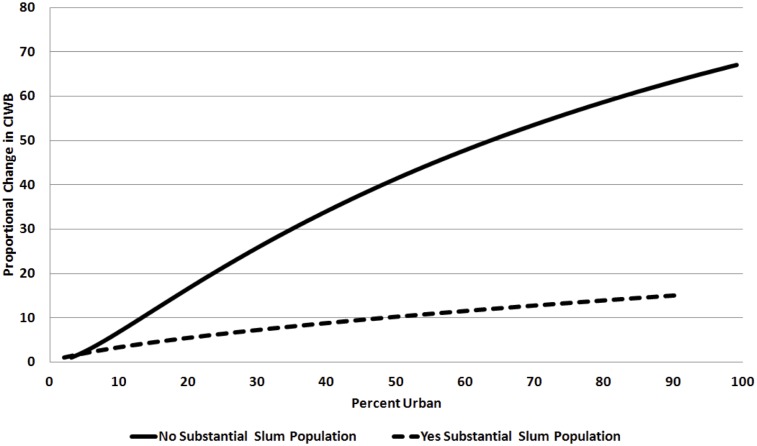
Fig 1. Dotted and solid lines represent, respectively, countries with and without substantial slum populations.
To draw the graph in Fig. 1, we first used slope estimates from Model 4 to get predicted values of CIWB (within the range of observations) and then exponentiated these values. Second, we identified a baseline, which equals the unlogged predicted value of the CIWB at the minimum level of urbanization for countries with and without substantial spopulations, respectively, around 2% urban and around 3% urban. Third, we divided the unlogged predicted value of the CIWB for each (higher) level of urbanization by this baseline, yielding a ratio equal to the proportional change in CIWB as urbanization increases, compared to the baseline. For instance, with a substantial slum population, when the country is 50% urban, its predicted CIWB is roughly 10 times greater than the predicted CIWB at the minimum level of urbanization (again, around 2% urban). Without a substantial slum population, at 50% urban, the CIWB is approximately 40 times greater than the predicted CIWB at the minimum level of urbanization (around 3% urban). Compared to countries with substantial slum populations (dotted line), the proportional change in CIWB for countries without substantial slum populations (solid line) is much higher at lower levels of urbanization. While, at higher levels of urbanization, the rate of increase in CIWB for countries without substantial slum populations begins to slow down, there is no turning point at which the CIWB begins to decrease. Moreover, as we also see from the estimates in Model 4, having a substantial slum population actually moderates the association between urbanization and CIWB, although the relationship is more approximately linear.

