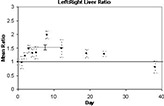
Figure 3. Time‐course of mean []FDG uptake ratio in liver. Each data point represents the mean left:right ratio of uptake values calculated for four mice. The ± standard error is indicated with dashed bars. A thick grey line corresponds to the mean for the range of dates indicated in Table 1 (days 3–12 for liver).