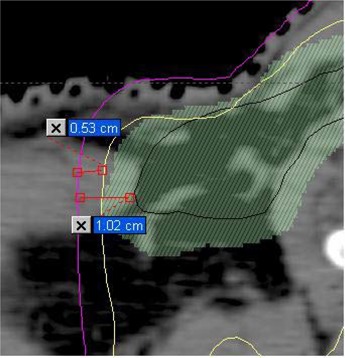
Figure 3. A detail of an IMRT plan at the shoulder level showing the physician‐drawn CTV (black contour), PTV after 5 mm expansion (green shaded area), 100% isodose line (yellow) and 75% isodose line (purple). Also shown are measurements indicating that the CTV is 1 cm away from the 75% isodose line, and that there is 0.5 cm between the 75% and 100% isodoses.

