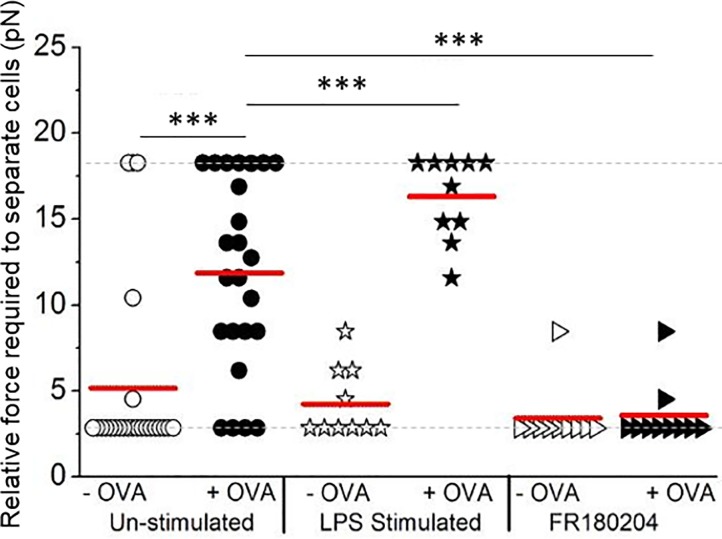
Fig 6. Interrogating changes in the cellular interaction force as a result of therapeutic intervention.
Cell interaction forces measured as in Fig 5 except that the dendritic cells were pre-stimulated with LPS or the T-cells were pre-treated with 10 μM of ERK-inhibitor FR180204 prior to analysis. After the optical trap was used to establish contact, cells were allowed to remain in contact for 120 seconds before measuring the relative interaction force. The plot shows the relative force required to separate the cell pairs with the median indicated with a red line, the dotted grey line represents the detection range. (*** p ≤ 0.0005, by Mann Whitney test).

