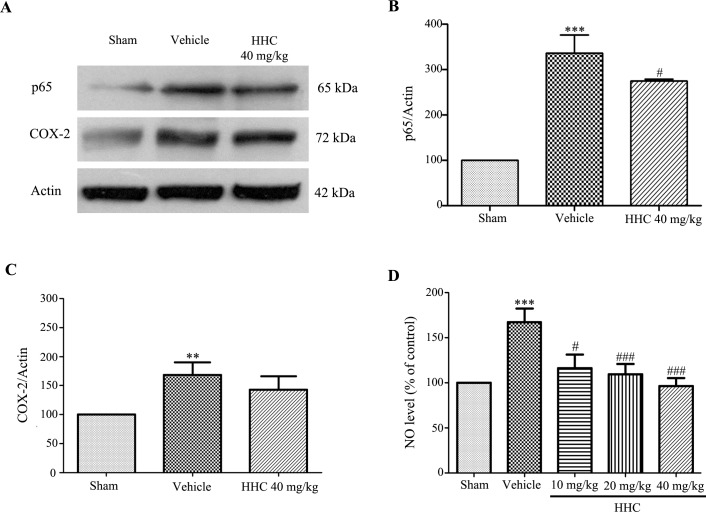
Fig 4. The effect of HHC on inflammation in cerebral I/R rats.
(A) Representative of the NF-κB (p65) and the COX-2 protein expressions, as examined by western blot analysis. (B) The quantitative results of the expressions of the NF-κB (p65) proteins in each of the groups. (C) The quantitative results of the expressions of the COX-2 proteins in each of the groups. (D) The effect of HHC on the NO level in stroke rats. The data are expressed as mean±SD. ** P < 0.01 versus sham group, and *** P < 0.001 versus sham group. # P < 0.05 versus vehicle group, and ### P < 0.001 versus vehicle group.

