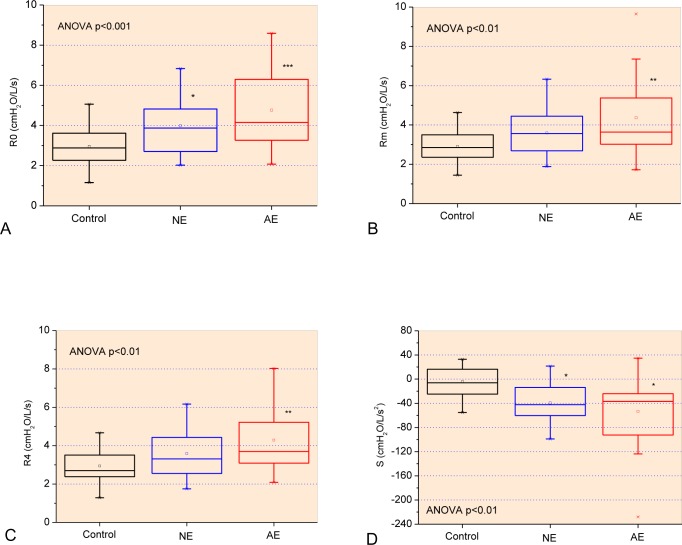
Fig 4.
Influence of changes in airway obstruction in resistive parameters obtained from the control group and patients with normal (NE) and abnormal (AE) spirometry: Respiratory system resistance (R0; Fig A), mean resistance (Rm, Fig B), resistance in 4 Hz (R4; Fig C) and slope of respiratory resistance (S; Fig D). *p<0.05 related to control group; **p<0.01 related to control group; ***p<0.001 related to control group.

