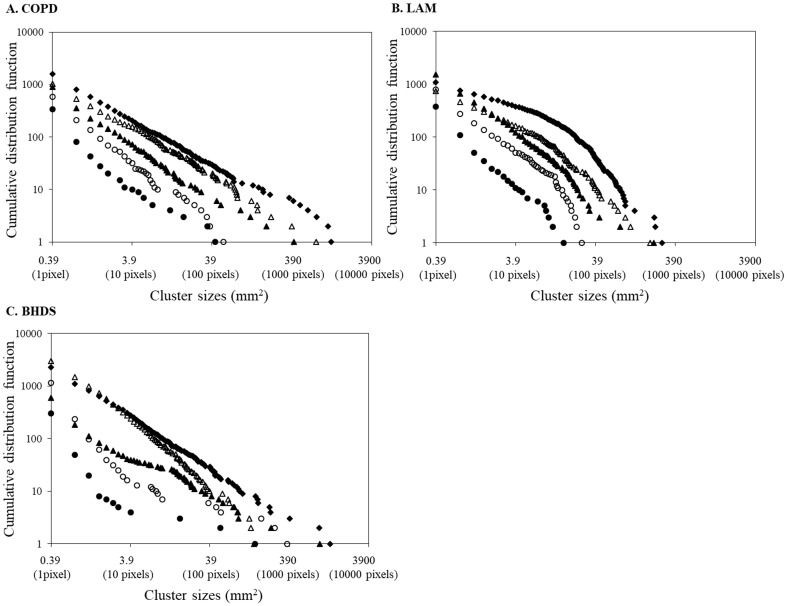
Fig 2. Log–log plots of representative cumulative frequency distributions of the size of LAA clusters.
In subjects with COPD (A), the five lung slices analyzed had LAA% values of 2.2 (●), 5.0 (〇), 15.2 (▲), 28.0 (Δ), and 42.1 (◆). In these five slices, r2 has a value of 0.96, 0.98, 0.99, 0.98, and 0.99, respectively. The corresponding D values are 0.97, 1.12, 0.98, 0.96, and 0.83, respectively. In subjects with LAM (B), the five lung slices analyzed had LAA% values of 2.0 (●), 6.7 (〇), 16.7 (▲), 26.9 (Δ), and 40.9 (◆). In these five slices, r2 has a value of 0.96, 0.93, 0.98, 0.95, and 0.89, respectively. The corresponding D values are 1.24, 1.34, 1.27, 1.11, and 1.11, respectively. In subjects with BHDS (C), the five lung slices analyzed had LAA% values of 2.0 (●), 5.7 (〇), 15.9 (▲), 24.6 (Δ), and 40.2 (◆). In these five slices, r2 has a value of 0.72, 0.84, 0.97, 0.99, and 1.0, respectively. The corresponding D values are 0.74, 0.78, 0.76, 1.30, and 0.97, respectively.
BHDS: Birt-Hogg-Dubé syndrome; COPD: chronic obstructive pulmonary disease; LAA: low attenuation areas; LAA%: percentage of lung field occupied by low attenuation areas; LAM: lymphangioleiomyomatosis.

