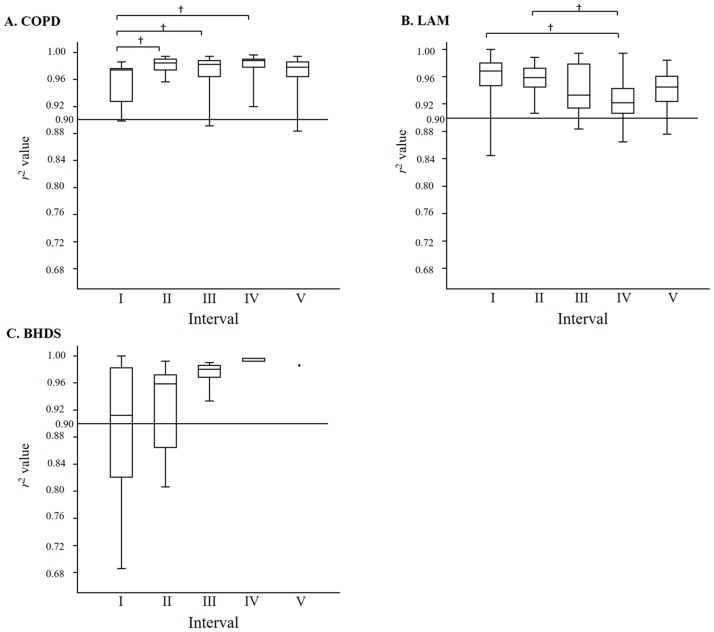
Fig 7. The comparison of r2 value among five LAA%-intervals.
A: In COPD, interval I was lower than II, III and IV, and there was no statistically significant difference among intervals II to V. B: In LAM, interval IV was lower than intervals I and II. The r2 value seemed to decrease step by step from intervals I to IV. C. In BHDS, there was no statistically significant difference among all intervals, however, r2 value seemed to increase step by step from intervals I to V. The line across the box indicates at the median. The bottom of the box is at 25th percentile, and the top is at 75th percentile value. The minimal and maximal values are shown with short horizontal lines ("whiskers"). The horizontal line at r2 = 0.90 in each panels A to C indicates the definition of fractal property. The figures above intervals in each panel indicate the percentage of CT images with fractal propety.
BHDS: Birt-Hogg-Dubé syndrome; COPD: chronic obstructive pulmonary disease; LAA%: percentage of lung field occupied by low attenuation areas; LAM: lymphangioleiomyomatosis; r2: values of coefficient of determination which indicate the goodness-of-fit of the power law
* p < 0.05, † p < 0.01.

