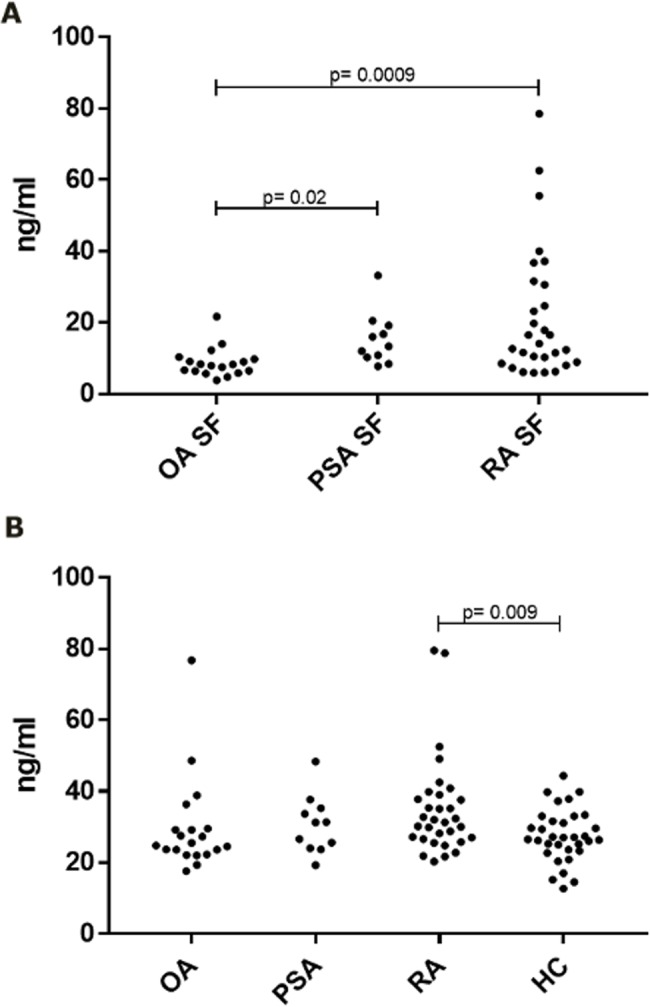
Fig 3. C5a levels in synovial fluids and plasma.

A. Synovial fluid levels. B. Plasma levels. Statistical analysis was with the Student’s t-test. P-values are uncorrected for multiple testing.

A. Synovial fluid levels. B. Plasma levels. Statistical analysis was with the Student’s t-test. P-values are uncorrected for multiple testing.