Figure 13.

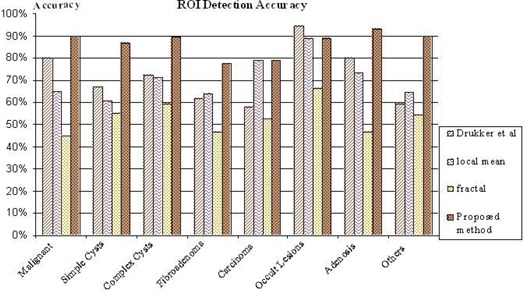
Graphical presentation of the region of interest (ROI) detection accuracy for each of the four algorithms and each type of abnormality.

Graphical presentation of the region of interest (ROI) detection accuracy for each of the four algorithms and each type of abnormality.