Figure 2.

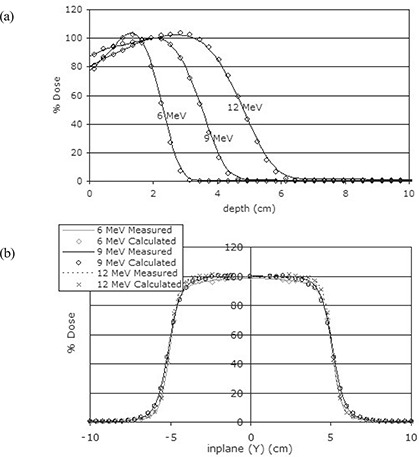
Comparison of measured and calculated (a) percentage depth dose curves (solid , ), and (b) dose profiles for the field size at 100 cm source‐to‐surface distance.

Comparison of measured and calculated (a) percentage depth dose curves (solid , ), and (b) dose profiles for the field size at 100 cm source‐to‐surface distance.