
Figure 11.
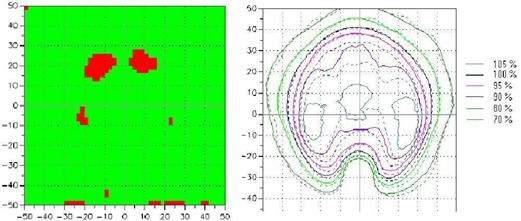
An example of the gamma distribution (left panel) and the measured and calculated dose distributions (right panel) with bilateral wedged dynamic arc for a scanned and calculated area of (the scale of coordinate axes is 10 mm). The green areas indicate regions where pixels passed the gamma acceptance criteria (3% dose difference and 3 mm distance to agreement); red areas indicate regions where pixels failed. The continuous and dashed lines represent the measured and calculated dose distributions respectively.